January 2020 (version 2.1.0)
Welcome to the first release of Querybook this year 🎉.
Following are the top new features we have added during these past two months:
- Advanced Querybook Charting: Transform data and create charts right from the query results! Added new chart types and customizations.
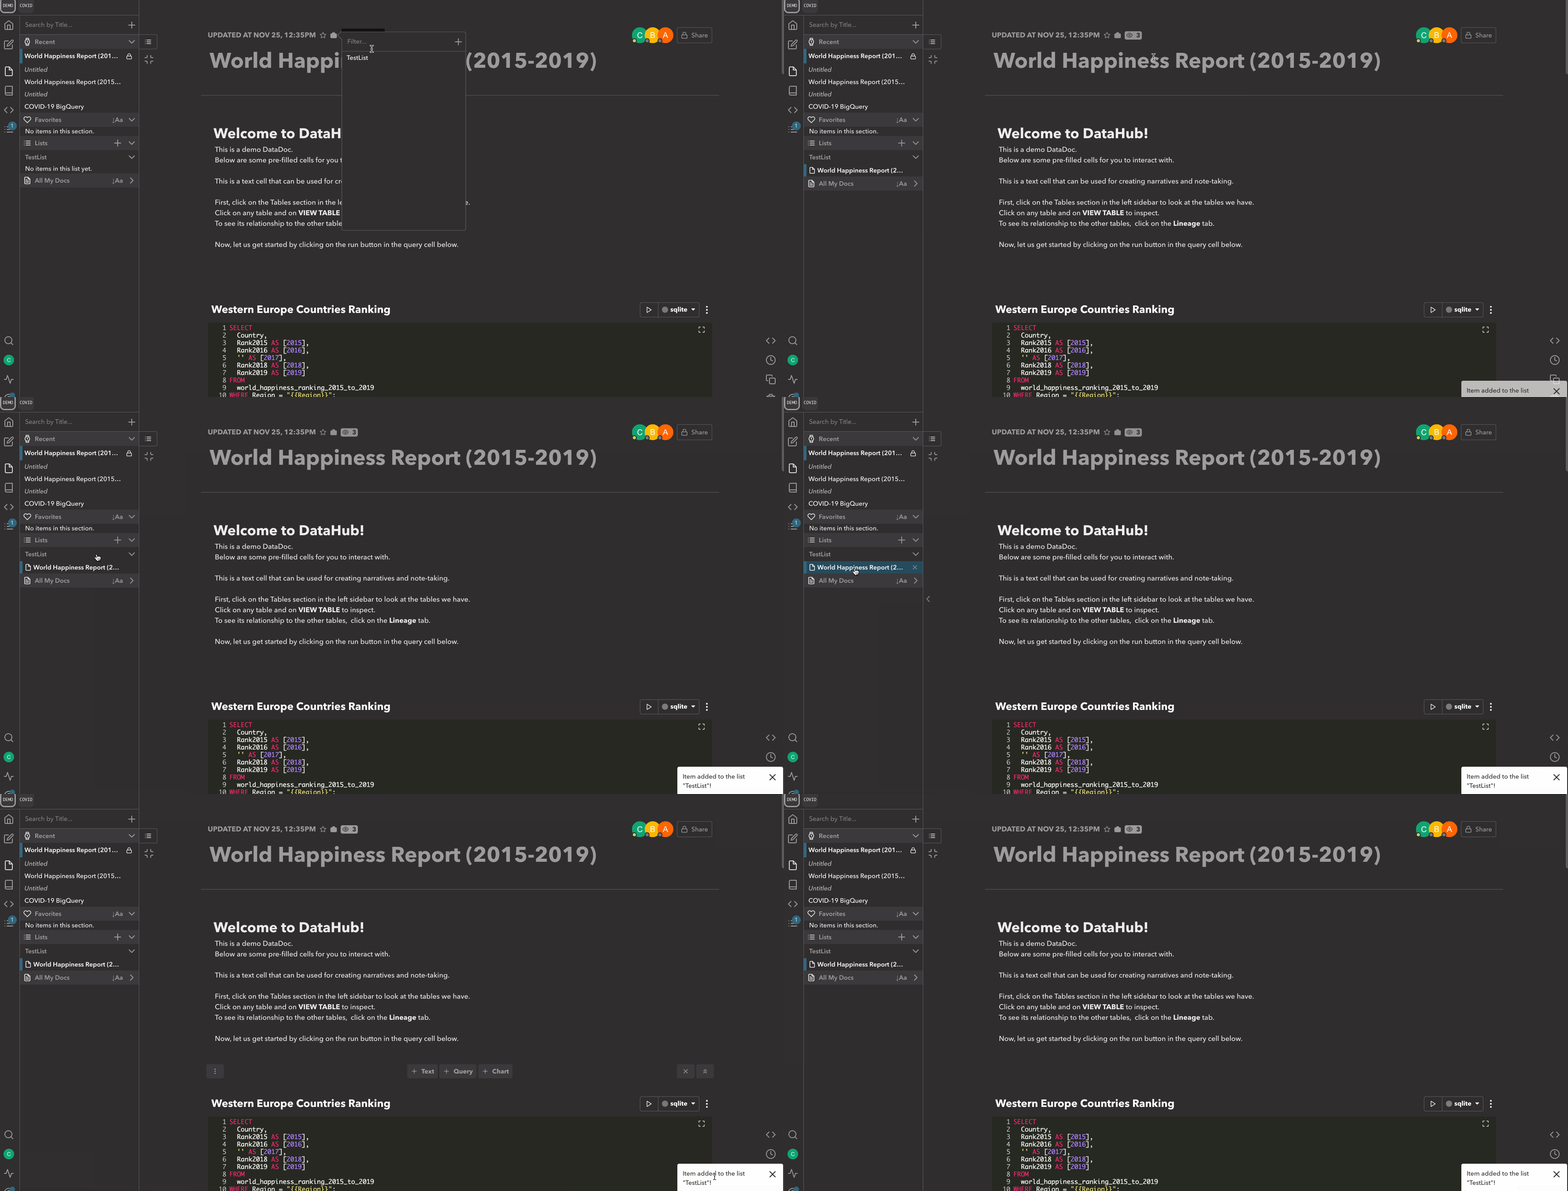
- Collections: Marie Kondo your workspace by grouping your DataDocs and favorite tables into lists!
- Improved Ad Hoc Querying: Convert a past run into an ad hoc execution with one click! Also draft ad hoc queries are now persistent as you navigate.
- Viewer Badge: Know your consumers! Each doc & table now has a badge to show the total number of views. Clicking it shows its top visitors and trends over time.
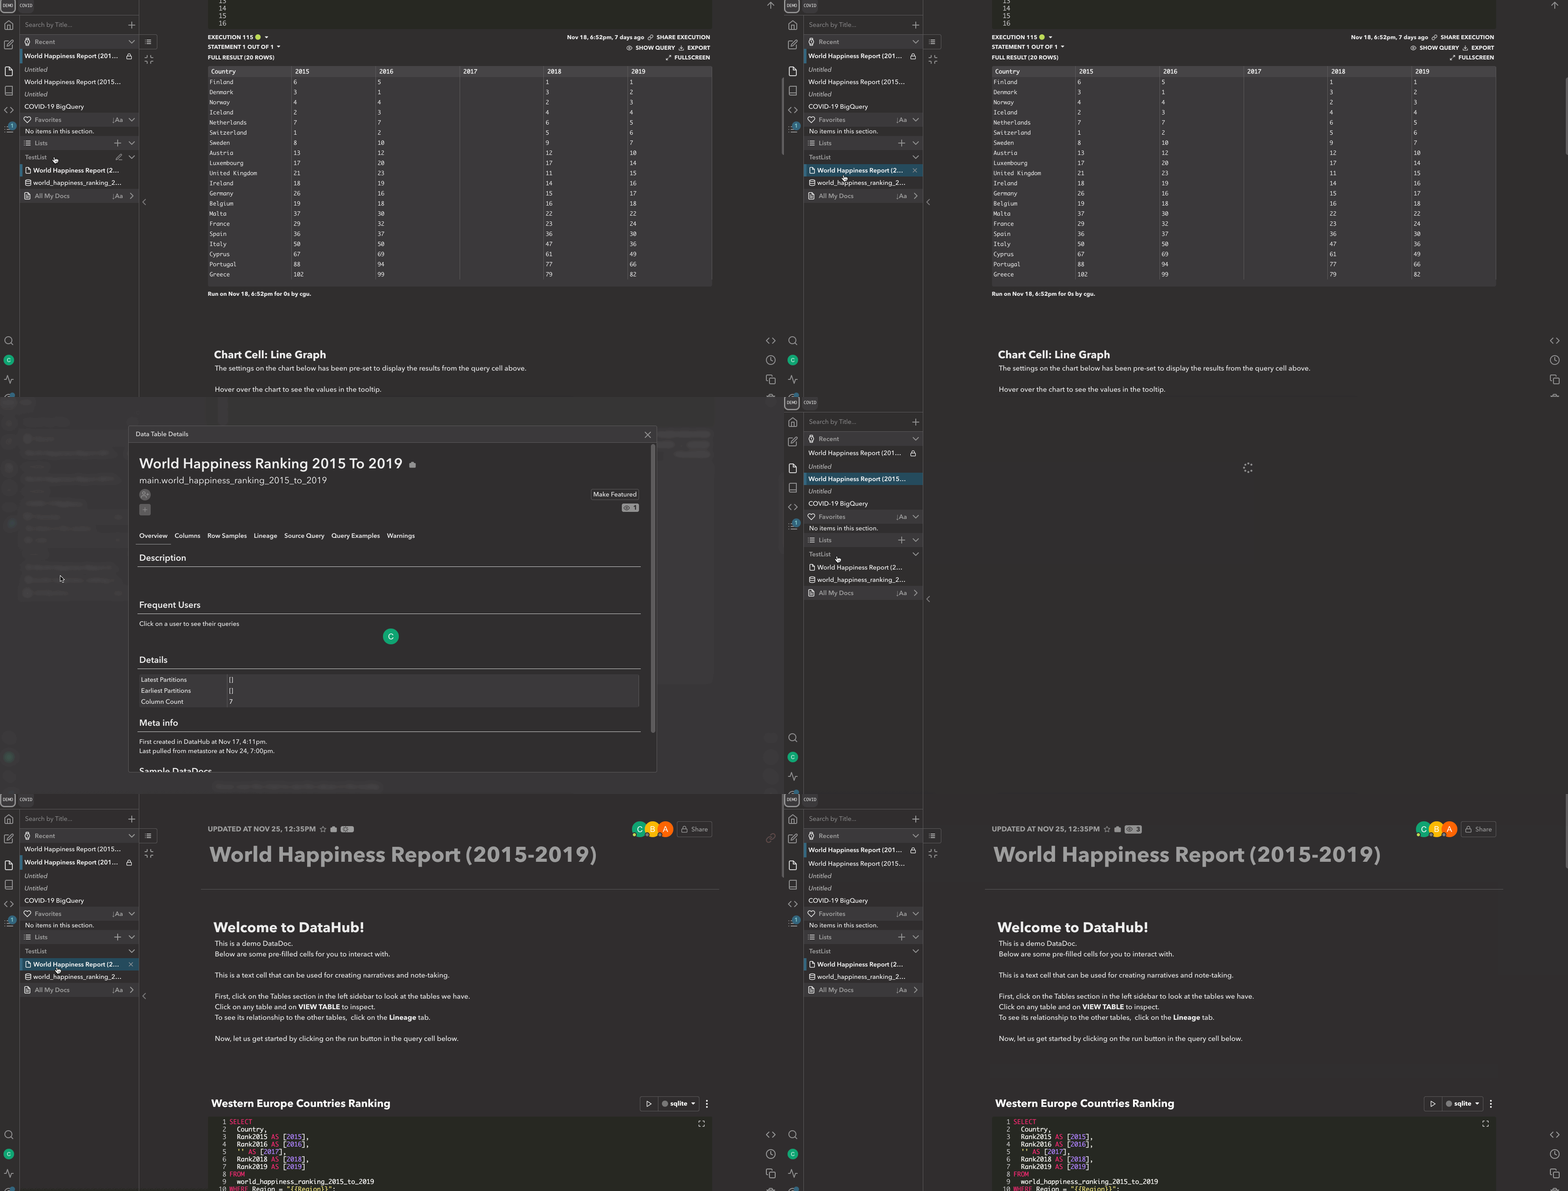
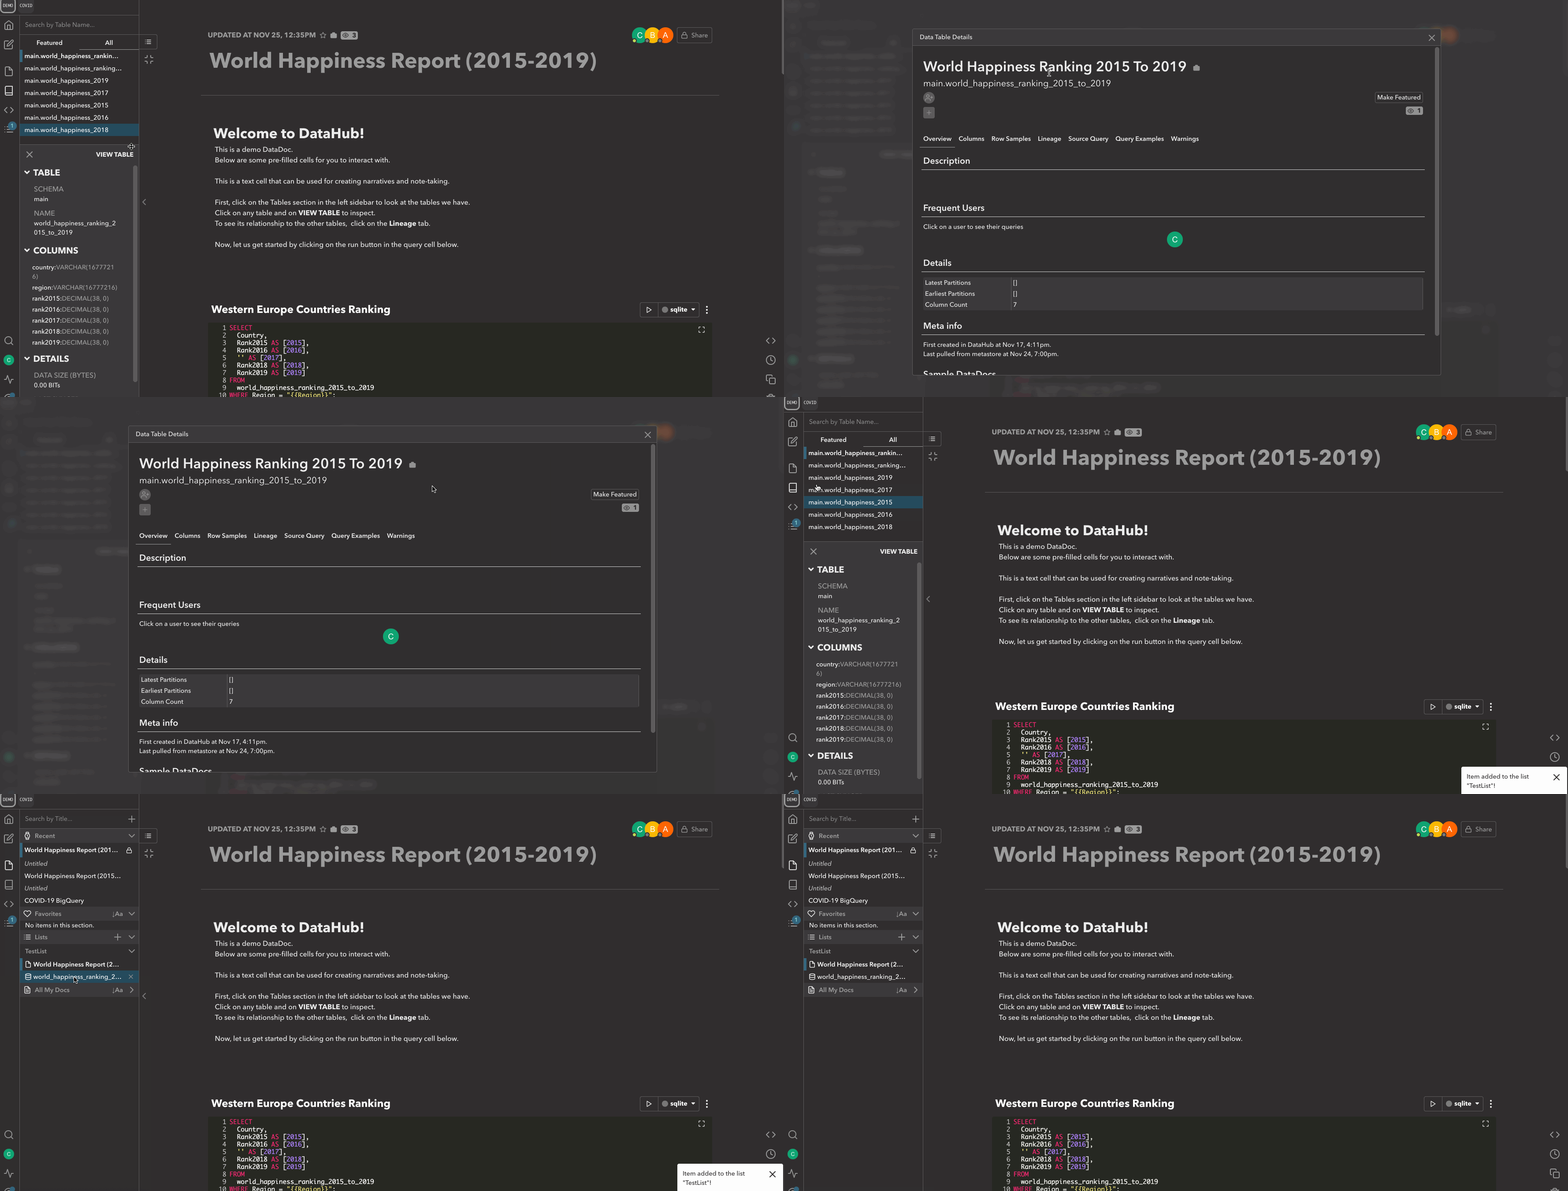
- Quick Table Reference: Double click bliss! You can now double click on a table to open it in a new persistent left sidebar when viewing a DataDoc.
Charting�
New Charting Features
- Additional Data Source Types
- Pick from any execution or let the chart update every time the query runs
- Transform Data
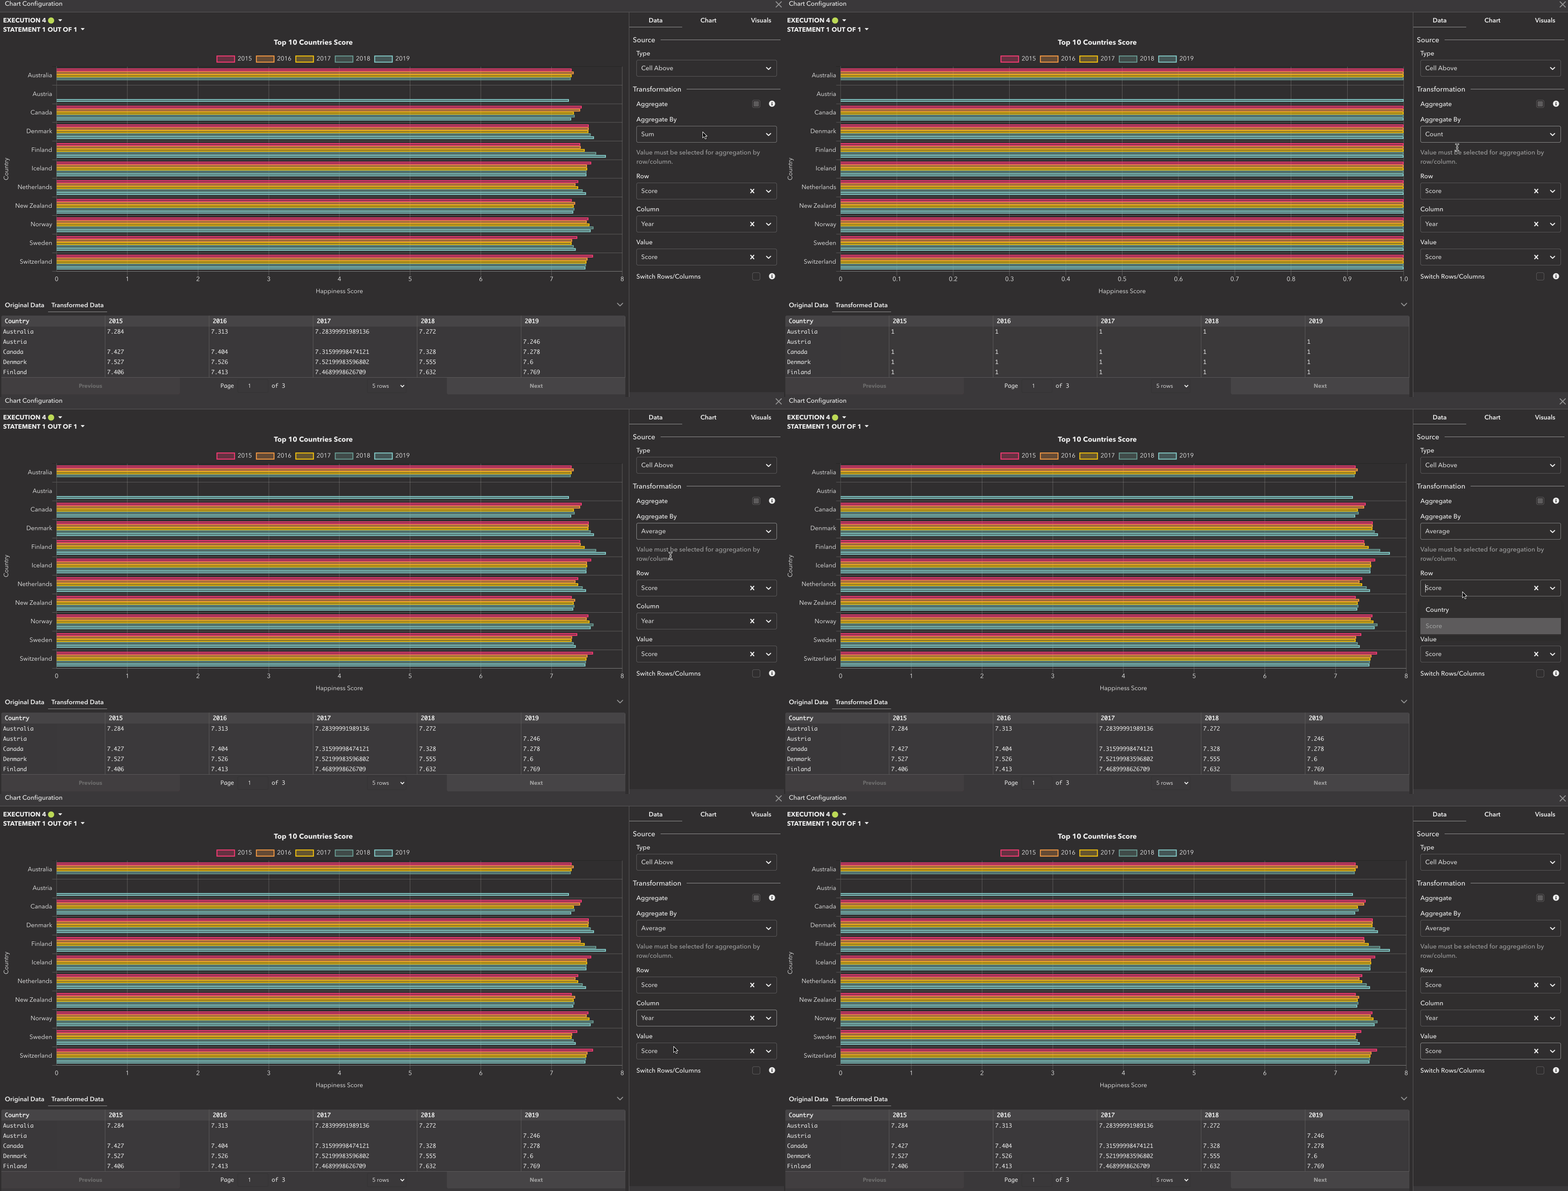
- Aggregate data - averages, counts, sums, min/max/median
- Switch rows and columns
- More Chart Types!
- Stacked Area
- Bar (+stacked)
- Horizontal Bar (+stacked)
- Pie
- Doughnut
- Scatter
- Table
- Detailed Display Options!
- Pick any column as x-axis
- Customize which series to display
- Titles, labels, legend positions, and more!
Chart Source/Type Example

Data Aggregation Example

Lists
List introduces a new way to organize any relevant and accessible data docs and tables together.

Creating a list
Create a list by going to the list tab and clicking on the “+” button. List's name is the only required field and does not need to be unique.

Once a list is created, you can add any data docs and tables. Clicking an already added doc/table will remove it from the list.


Querybook Team
Charlie, Gu, Lena Ryoo
Pinterest
🚀